Measurement: Energy Efficiency and Electrification Guide
Measurement enables ongoing tracking of demand-side program impacts through transparent, revenue-grade measurement of projects and events. Measurement delivers continuous reporting on the performance of deployed demand-side assets during program execution.
Measurement is available across both project and event-based program designs, each with an associated set of features tailored to its use case.
Project-Based Programs:
- Overview: Summarizes portfolio-level results and provides insights into individual project performance
- Measurement Breakdown: Details all components of the meter-based energy savings calculation at the portfolio level and the meter level
- Electric Comparison Group Audit: Gives insights and metrics on comparison group selection and meter-based electricity savings impact
- Gas Comparison Group Audit: Gives insights and metrics on comparison group selection and meter-based gas savings impact
Project-Based Measurement
Energy Efficiency | Electrification
Measurement for project-based programs presents results at the program level for all projects enrolled in the program, including energy savings, realization rates, and (where applicable1) Total System Benefits (TSB), and GHG impacts. This page provides a high-level view of the program's performance, with the ability to filter to specific groups of projects for further analysis. The Measurement tab contains 5 key sections, which all get updated when any filters are applied:
- Total Performance
- Performance by Category
- Performance by Time
- Savings Distribution
- Project Performance
Depending on your specific Measurement configuration and data availability, filtering options can include:
- Program Group
- Aggregator
- Project Start Quarter
- Measure Category
- Net Metering (ie. solar) True/False
- Low/Medium Income Flag
- Show only Mature Projects
- When turned on, only projects measured for a full year post-intervention will be shown.
- Remove Meters with Assigned Savings
- When turned on, metrics will update to exclude assigned savings for disqualified meters
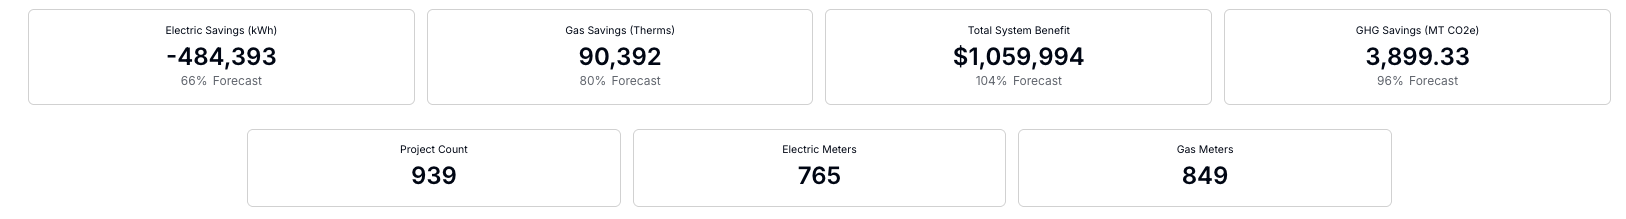
Summary metrics provided can include:
- Electric & Gas Savings
- Includes both measured savings and comparisons to forecasted savings
- Does not include savings beyond each project’s first reporting year
- Total System Benefit
- TSB is an expression, in dollars, of the lifecycle energy, ancillary services, generation capacity, transmission and distribution capacity, and GHG benefits of energy efficiency activities, on an annual basis. TSB represents the total benefits, or “avoided costs,” that a measure provides to the electric and natural gas systems
- GHG Savings
- Project Count
- Includes all projects that have been enrolled and measured at least once
- Electric and Gas Meters in Tracking
- Includes meters that are currently in the first reporting year, or that have reached maturity (ie. completed the first reporting year)
-
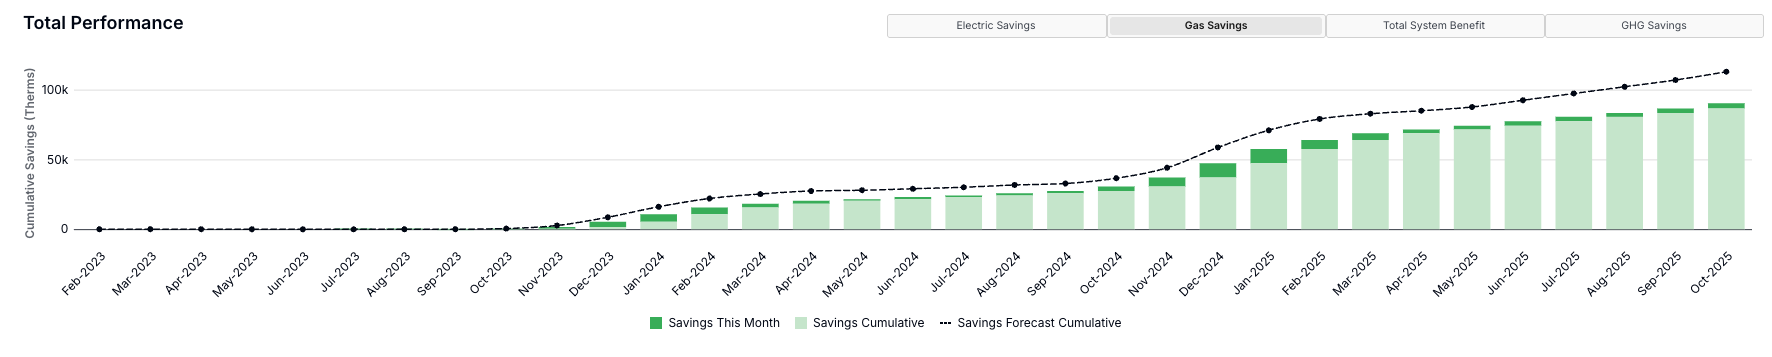
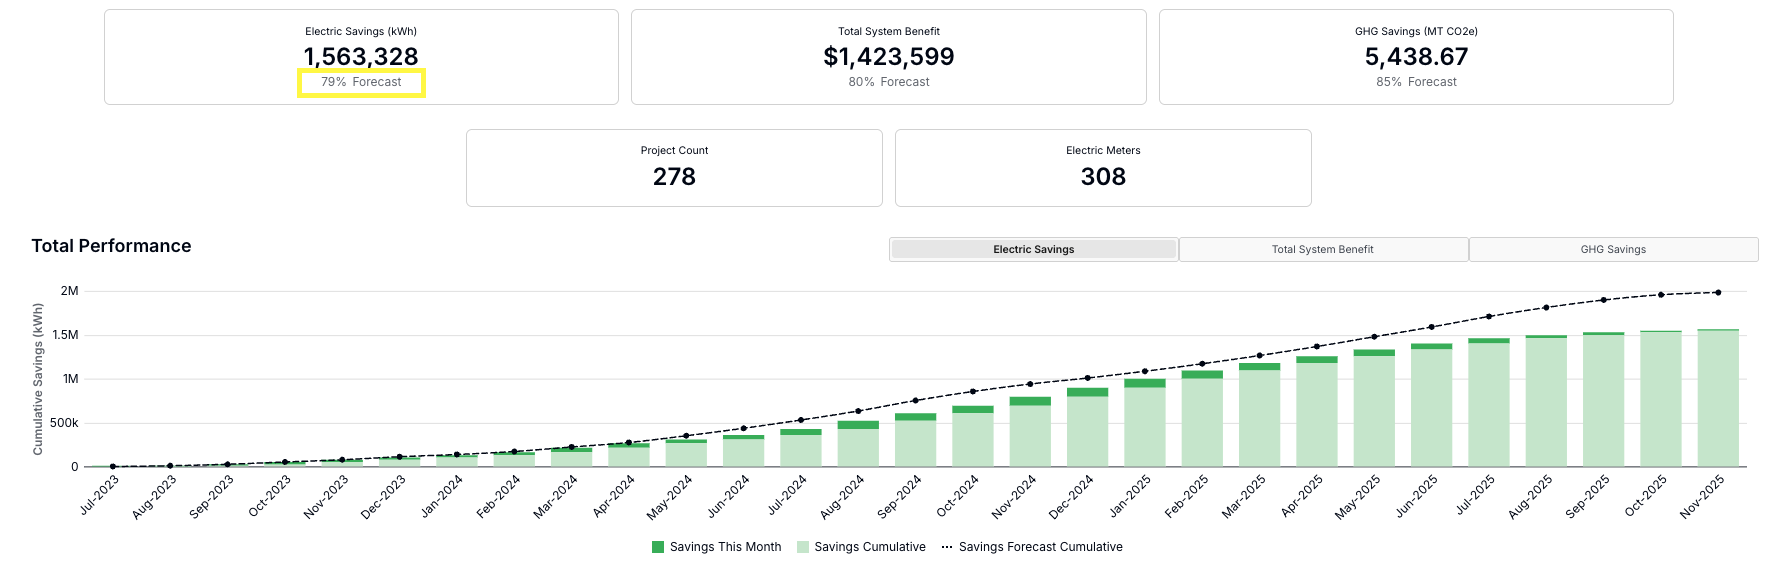
Total Performance
This section provides the cumulative total measured and forecasted savings by month for electric meters, gas meters, Total System Benefit, and GHG savings.
-
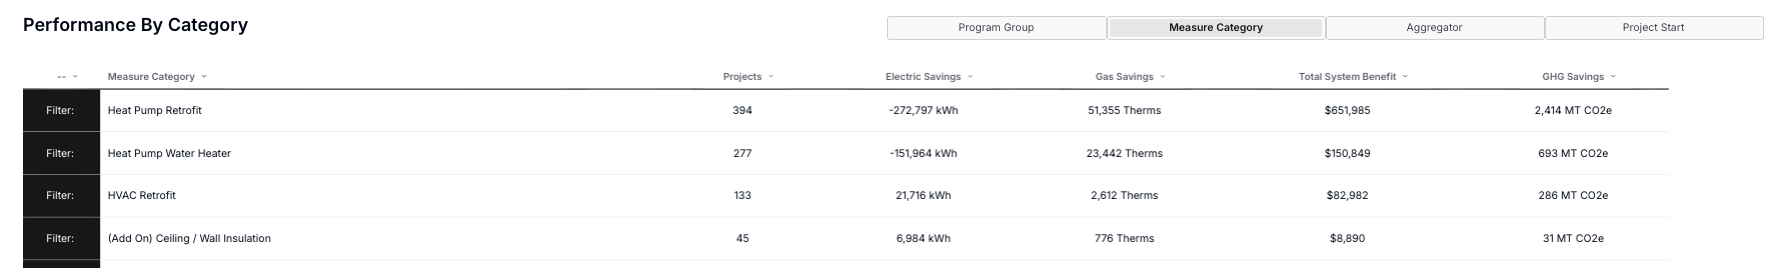
Performance by Category
This section allows users to investigate performance by four different categories: Program Group, Measure Category, Aggregator, and Project Start. In each table, users can click “Filter:” for a given row to see only the associated performance across all sections on the page.
-
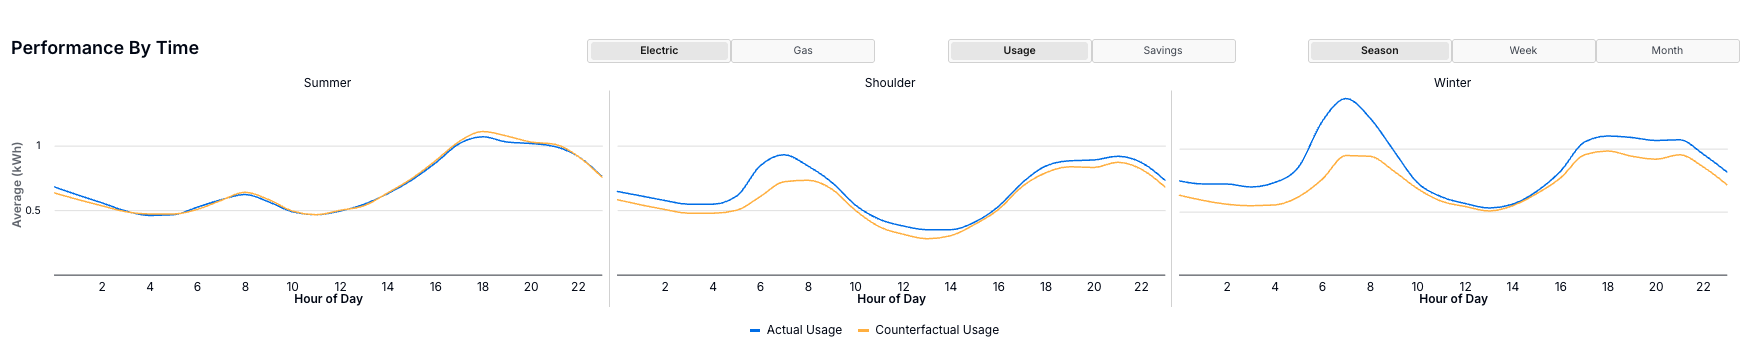
Performance by Time
This section illustrates actual vs. counterfactual usage or savings vs. forecasted savings for both fuel types. The data can be shown at varying granularities, including by season, week, or month, depending on the source data resolution.
-
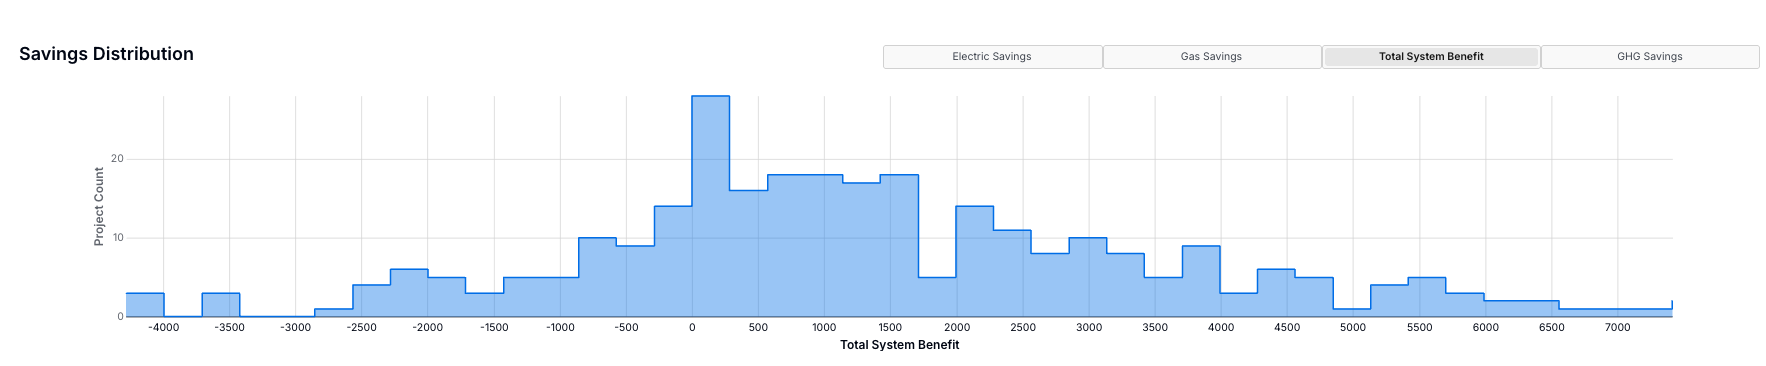
Savings Distribution
This section displays a histogram of projects by savings, Total System Benefit, or GHG reduction, where applicable.
-
Project Performance
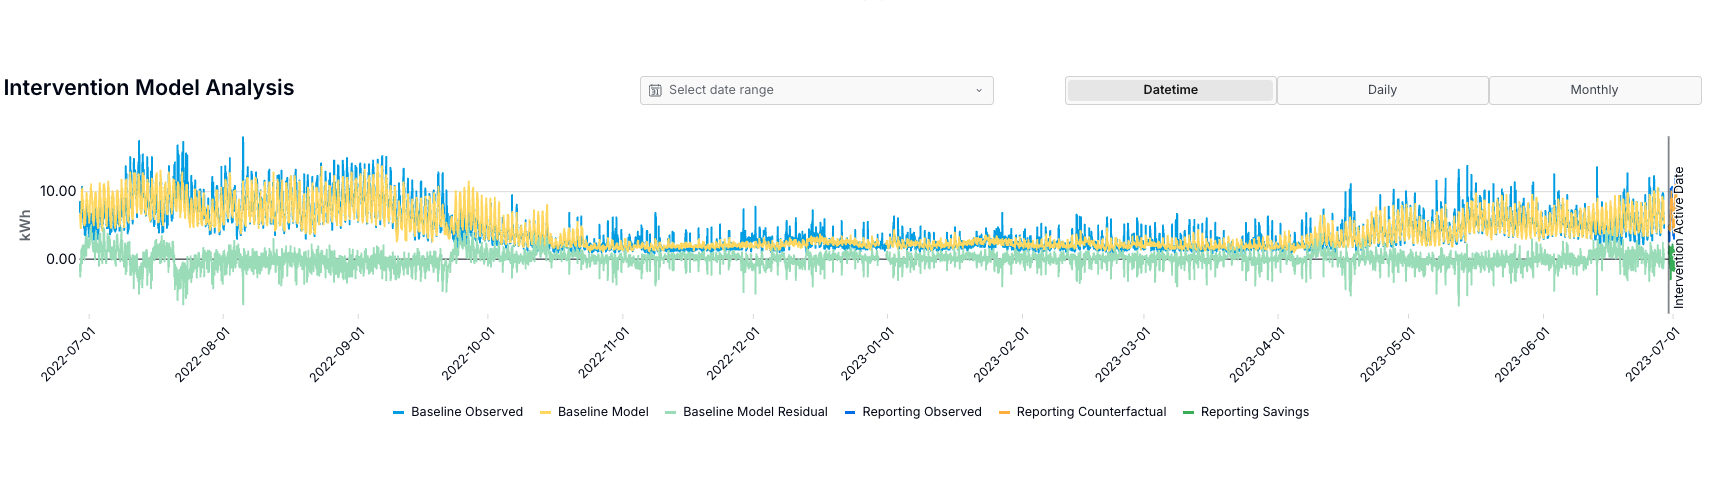
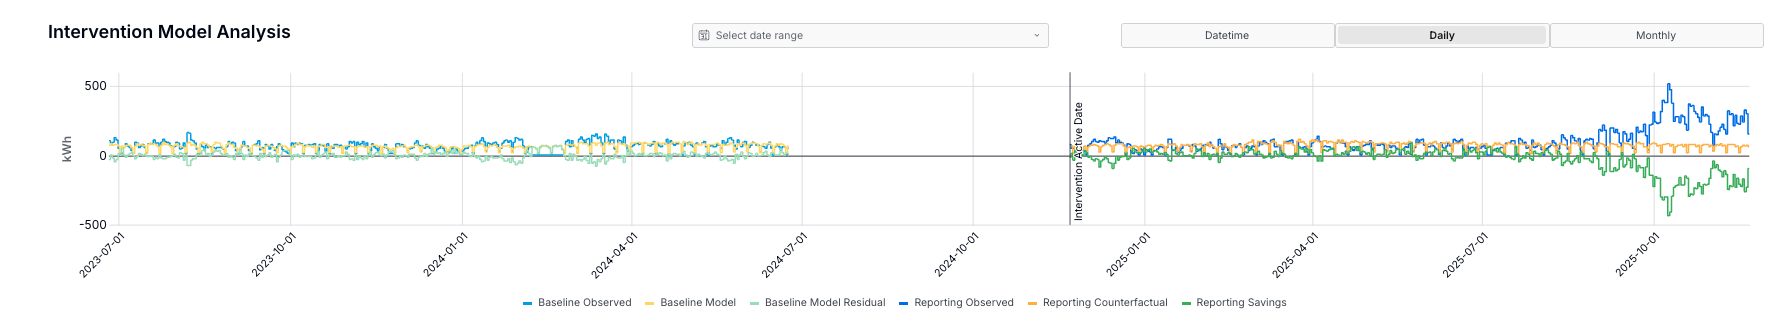
The Project Performance section provides insights into individual project performance. Users can view results either ‘By Project’ or ‘By Meter’, which offers detailed information on the project location, program group, actual and forecasted savings, measure categories, and meter disqualification descriptions. By drilling down into the “Details:” of an individual project or meter, users can understand individual actual vs. counterfactual usage, savings by season, week, or month, as well as timeseries counterfactual and observed data across baseline and reporting periods.
These charts can help identify unexpected or sudden changes to energy consumption trends, which may be indicative of an issue with the data collection, poorly configured retrofit equipment, or indicative of a non-routine events, such as new equipment added, or new tenants with different occupancy patterns.
Clicking the “Export” button at the top of the Details page will provide a table of the full measured impacts, including counterfactuals, for all meters associated with the project. This matches the data available in the Intervention Model Analysis chart and is intended to aid with project investigations and reporting needs.
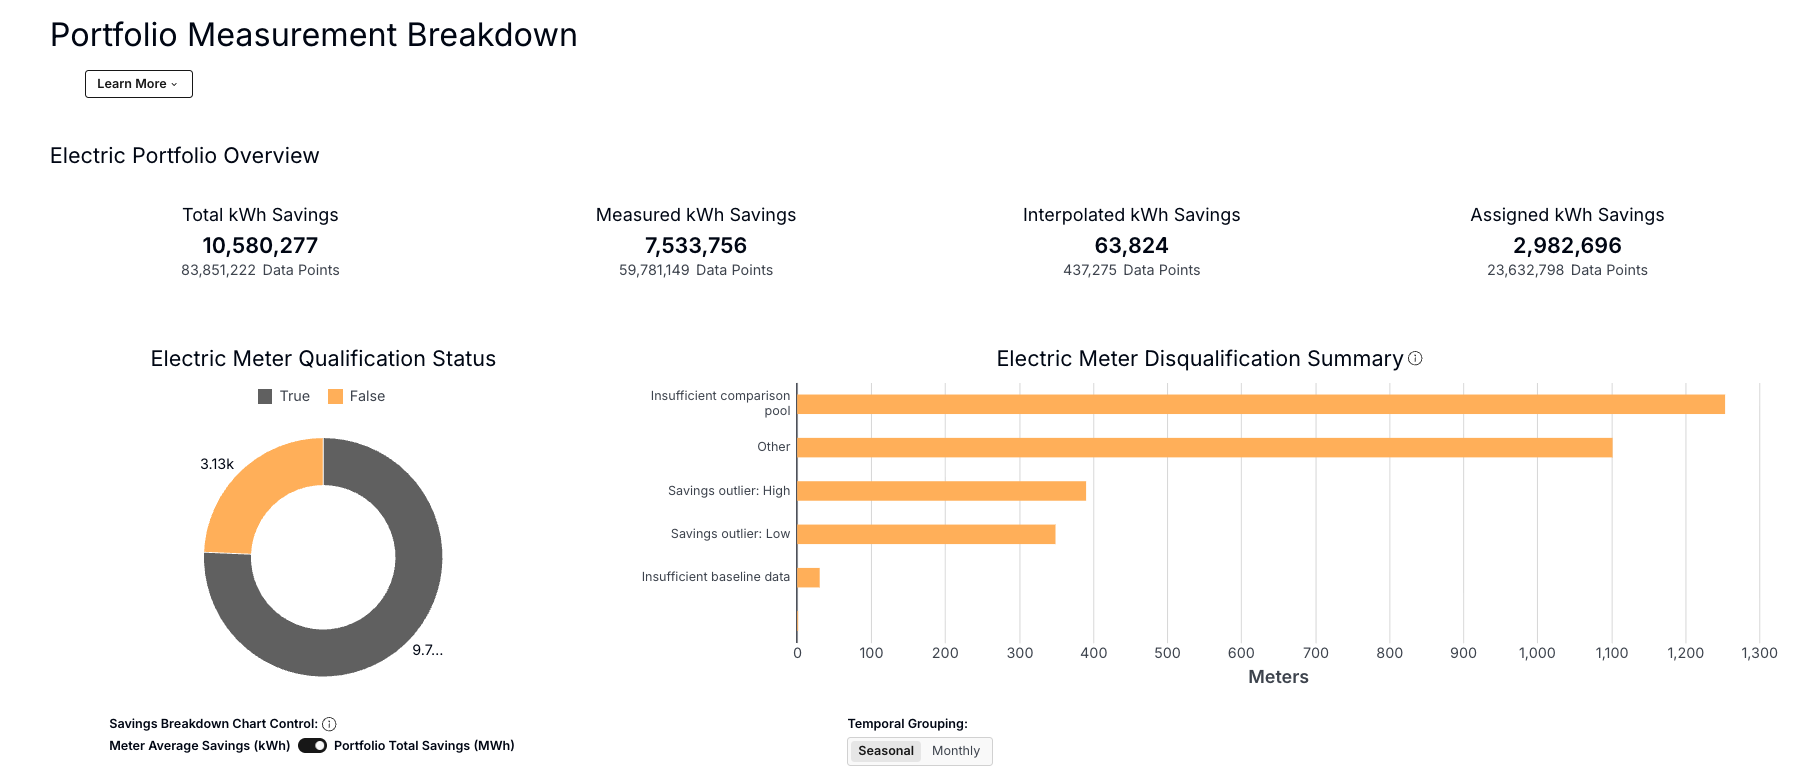
Measurement Breakdown
This tab details all components of the meter-based energy savings calculation at the portfolio level. This includes accounting for disqualified meters as well as a breakdown of the three savings types2:
- Measured savings: Savings calculated for meters that pass disqualification criteria and where all requisite consumption and temperature data points are available
- Interpolated savings: Even among meters that pass all disqualification criteria, consumption or temperature data points can be missing - in these cases, an interpolation algorithm is used to restore missing savings data points
- Assigned savings: Calculated savings for the meters that are disqualified from a measurement
Summary statistics are presented for electricity and gas meters to provide an indication of how many projects are receiving interpolated or assigned savings (and in what quantities). Significant amounts of interpolated or assigned savings may indicate routine quality and completeness issues in the meter or temperature data.
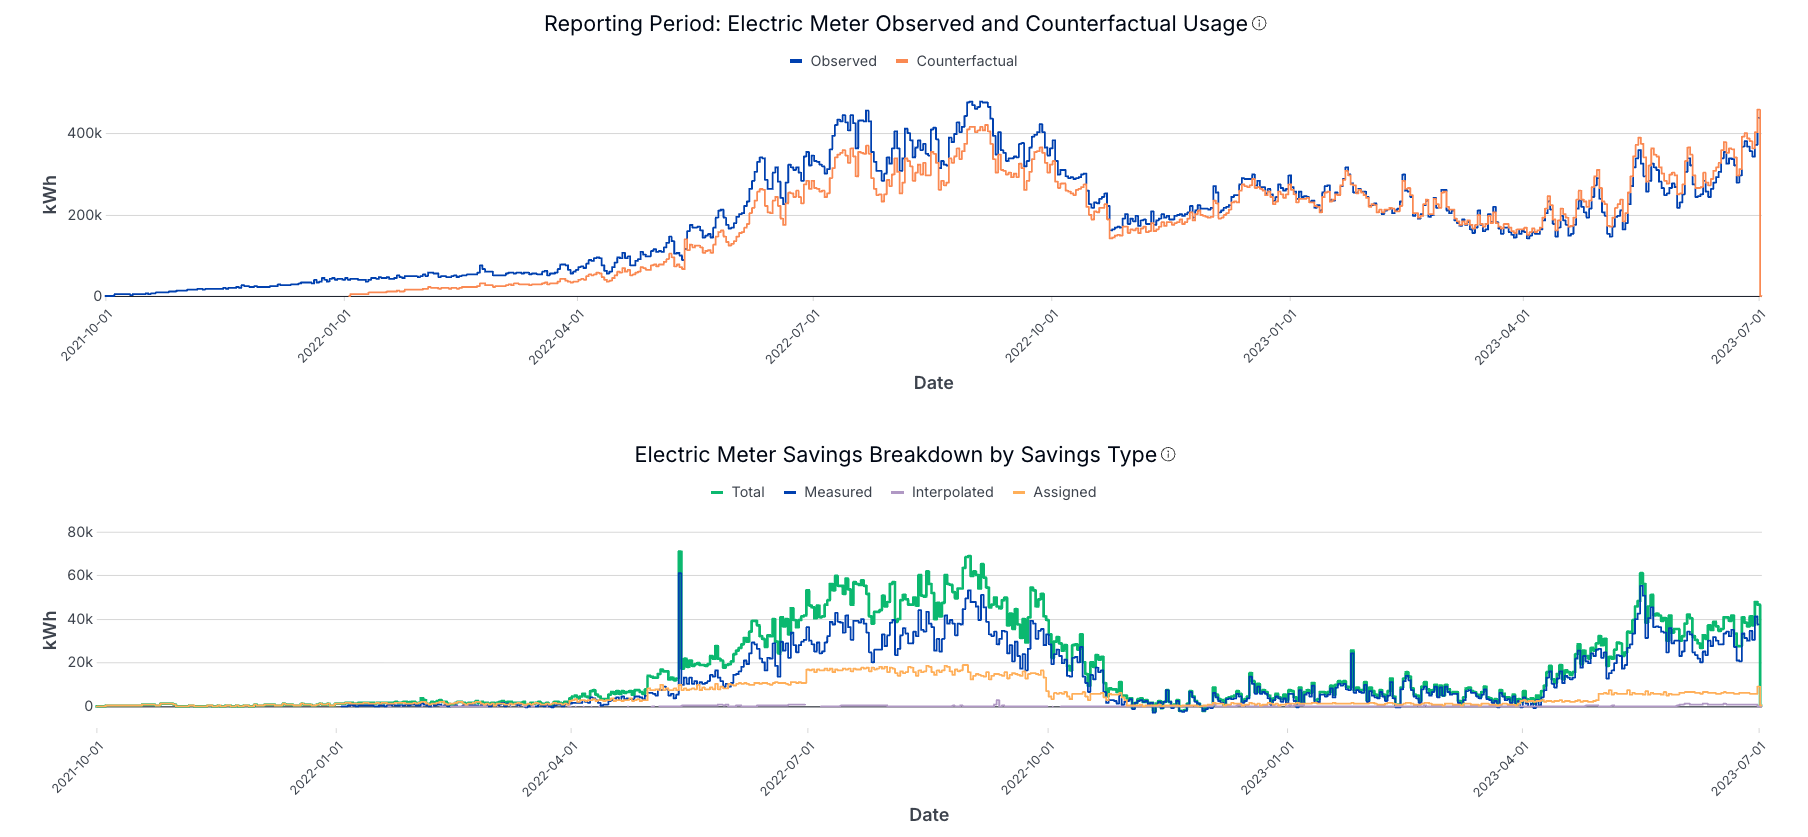
Similar to the Project Performance section in the Measurement tab, time series data is also displayed on the Measurement Breakdown tab, filterable for specific projects. This section compares the modeled baseline and reporting-period performance, both uncorrected and corrected using comparison groups. This provides an indication to the user how well the model fits the data and how substantial the comparison group corrections are. Comparison groups correct for exogenous effects experienced by participants and non-participants.
Electric & Gas Comparison Group Audit
Comparison groups are used to isolate and remove reporting-period model error unrelated to program participation, including error from external factors such as economic trends, pandemics, or natural disasters. If your program uses comparison groups, then the Electric and Gas Comparison Group Audit tabs provide insights and metrics on comparison group selection and highlight the meter-based savings impacts of comparison group corrections.
Comparison groups are formed by selecting non-participant meters with pre-retrofit energy-use characteristics similar to those of the treatment meters, based on similar load shapes or model-error patterns. OpenDSM models are fit to each comparison-group meter to quantify the corrected counterfactual for each program participant. By analyzing how non-participants’ energy usage patterns deviated from their modeled counterfactuals, each measurement accounts for exogenous factors that exist at the population level. Any savings calculated for treatment meters are adjusted to account for changes in the comparison group's performance, thereby removing factors experienced by the broader population.
Example - Investigate Projects with Low Realization Rates
This example illustrates how Measurement can be used to investigate the distribution of realization rates within a portfolio of projects and to identify projects with poor performance.
The image below depicts an example portfolio in the Measurement tab’s Total Performance section - electric savings by month, which indicates a healthy savings realization rate of 79%. However, an inspection of the Project Performance section indicates that some projects have negative realization rates, which reduce the overall portfolio performance.
The user can examine a poorly performing project in the Project Performance table by clicking “Details:” for the relevant project. In the example below, the data reveal uniquely high Reporting-year loads starting in late summer 2025 and growing to nearly quadruple the expected consumption, which do not appear in the Baseline period.
Additional Notes & Documentation
Please refer to the detailed technical documentation below for more information. If you have further questions or need additional assistance, please don’t hesitate to reach out to us at support@recurve.com:
- Assigned Savings & Interpolation
- Open Source Methods
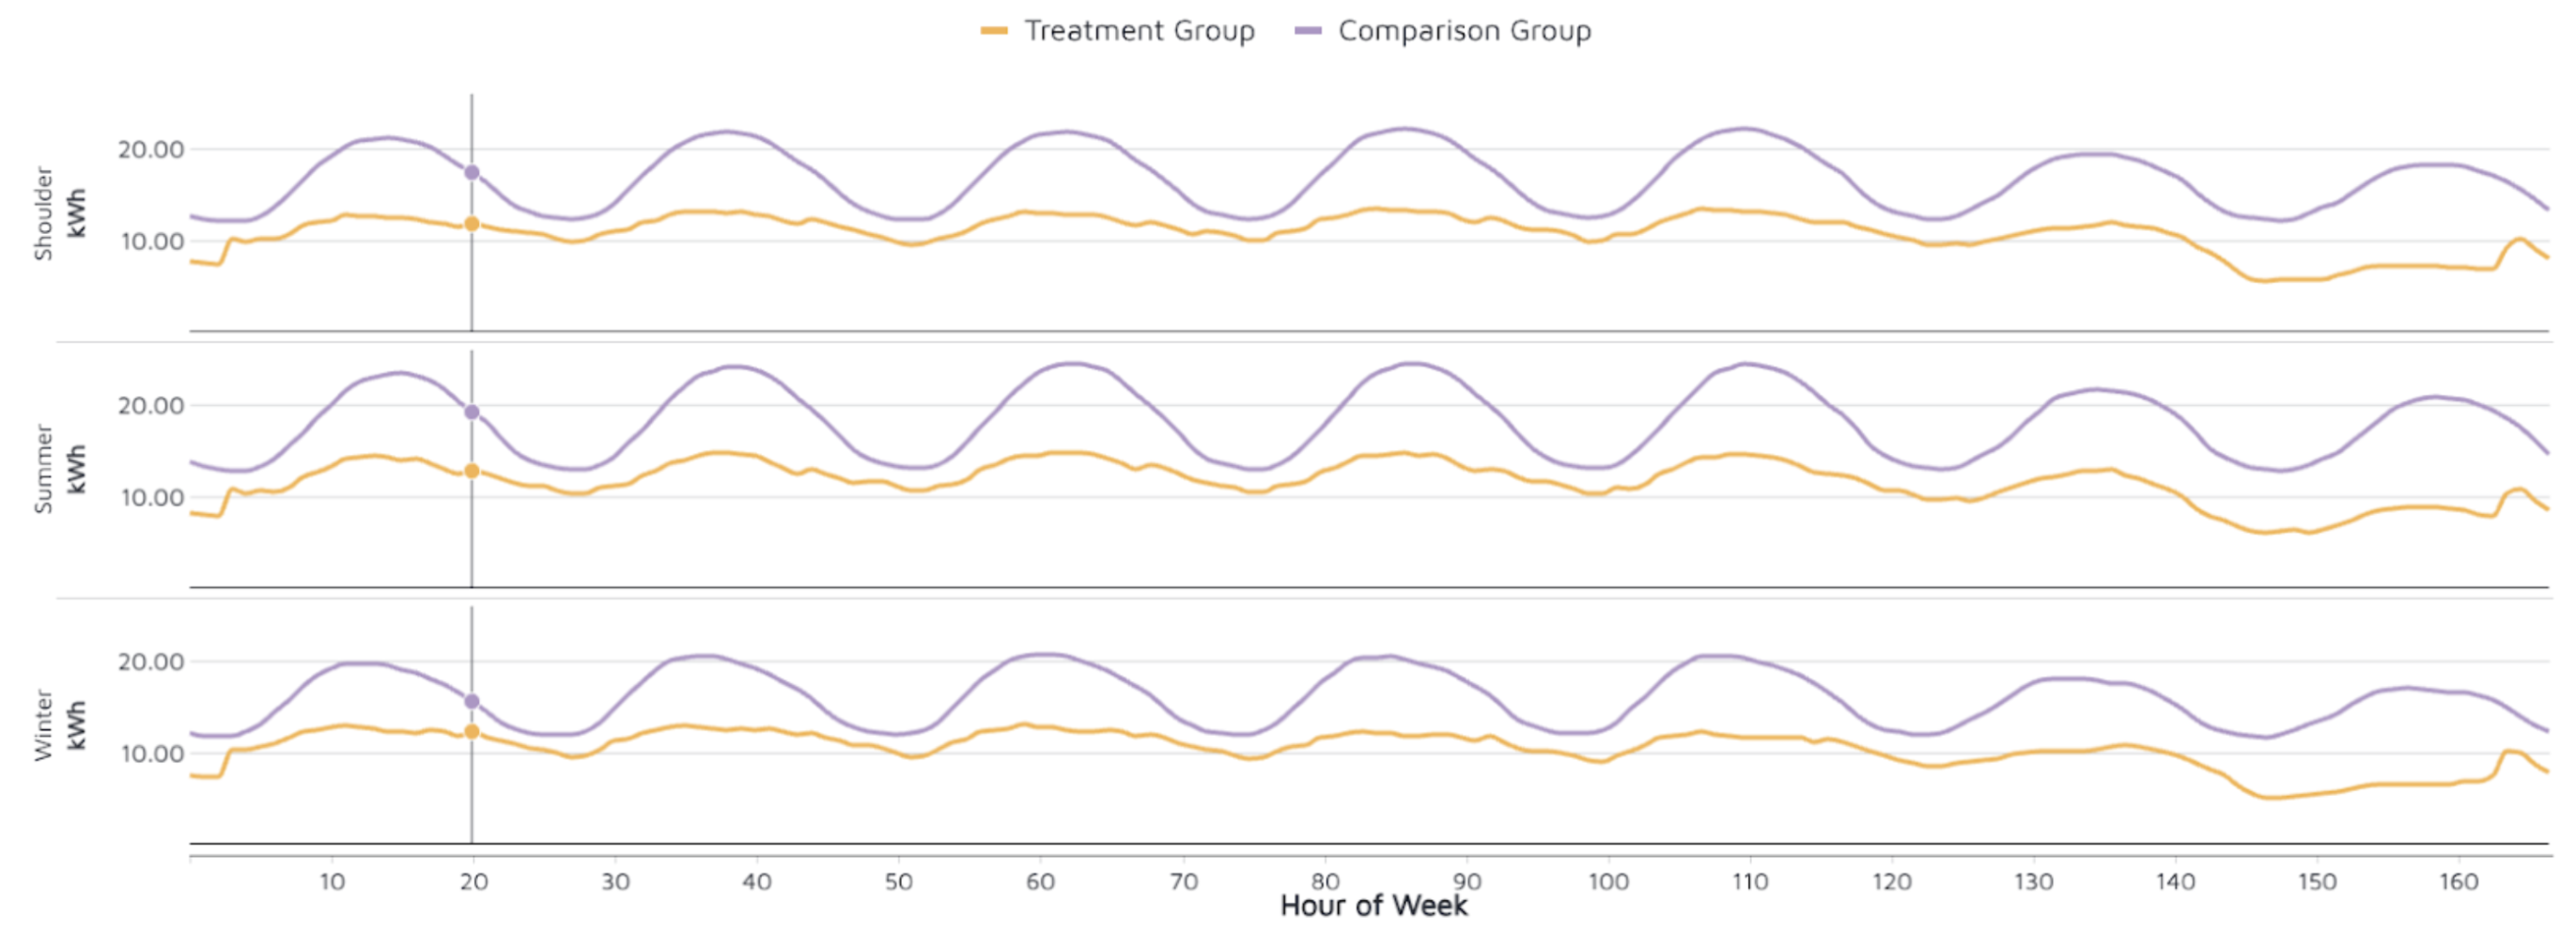
- The Comparison Group Selection - Portfolio Summary section illustrates the Treatment Group and Comparison Group seasonal hour-of-week load profiles, to provide users with an indication of how closely the comparison group consumption matches the treatment group consumption. The image below illustrates an example where the comparison group load profile has slightly less variation throughout the weekdays than the treatment group, and much less variation on Sundays. This type of discrepancy is common for commercial projects where the comparison pool is relatively limited, but it does not necessarily mean the comparison group is poorly formed. However, larger differences in load shape (magnitude and/or shape) can indicate an excessively small comparison group, which may be susceptible to unique energy consumption patterns at comparison-group meters, potentially introducing relatively large errors in comparison-group-corrected savings calculations for treatment meters.
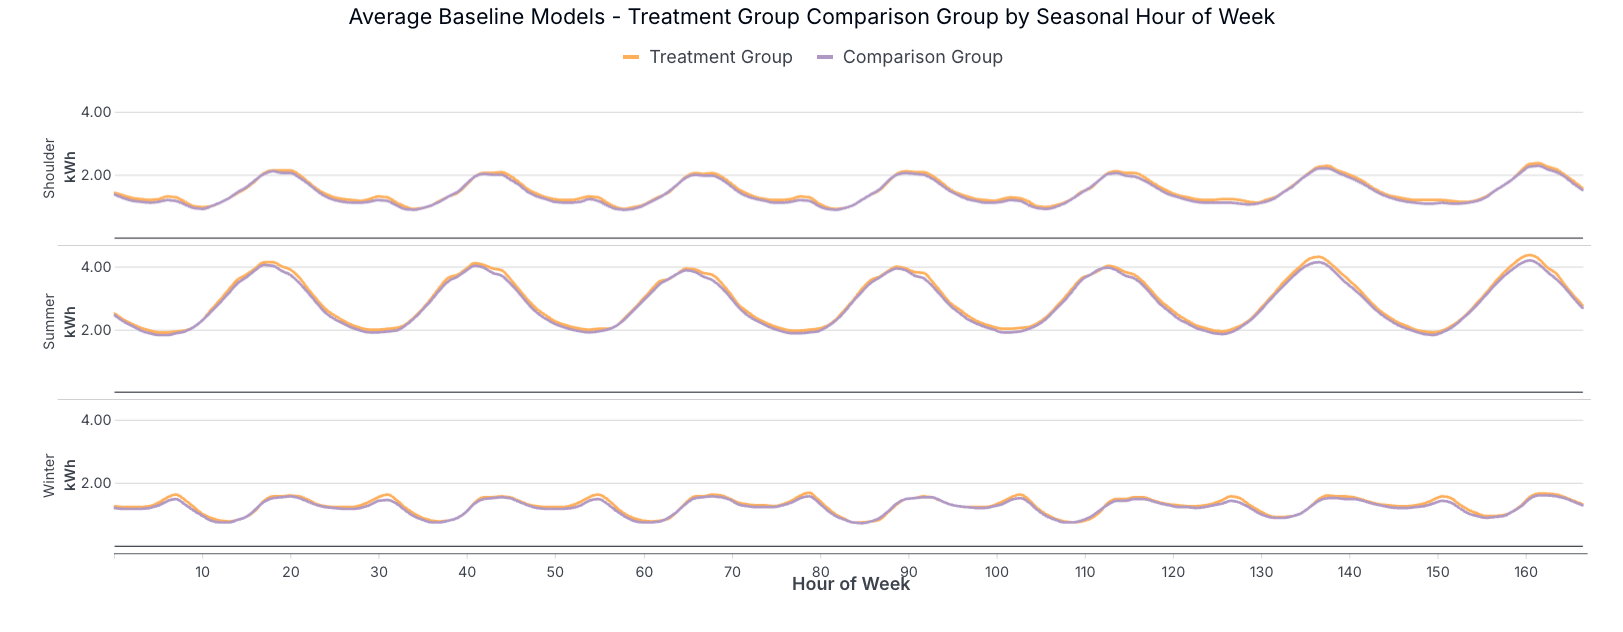
In contrast, the image below shows a comparison group that nearly matches the treatment group, indicating that both groups are drawn from a nearly identical broader population. Highly similar load shapes are often observed in residential populations, where hundreds (or thousands) of non-treatment meters are available to match each participant meter.
Footnotes
-
System costs and emissions metrics are available for jurisdictions with Avoided Cost Curves, e.g. California ↩
-
See this document for a detailed discussion of interpolation and assigned savings. ↩